“I Think We’re Doing Fine”
Is Not a Strategy
Autotask Live Reports Built for Your MSP
Install Yourself or Have Us Do It For You!
📊 LiveReport Packs
Built For MSPs Who Need Truth, Not Guesswork
Our LiveReport Packs reveal what’s actually happening in your PSA — performance, profitability, ticket chaos, technician behavior, billing leakage…you name it
Each of our Report Packs has been crafted by someone who has been deep in the PSA trenches — built to surface the metrics that move QBRs, renewals, staffing, and pricing conversations. Our goal, just data clarity that helps you run a smarter, more profitable MSP.

See how your team is really performing.
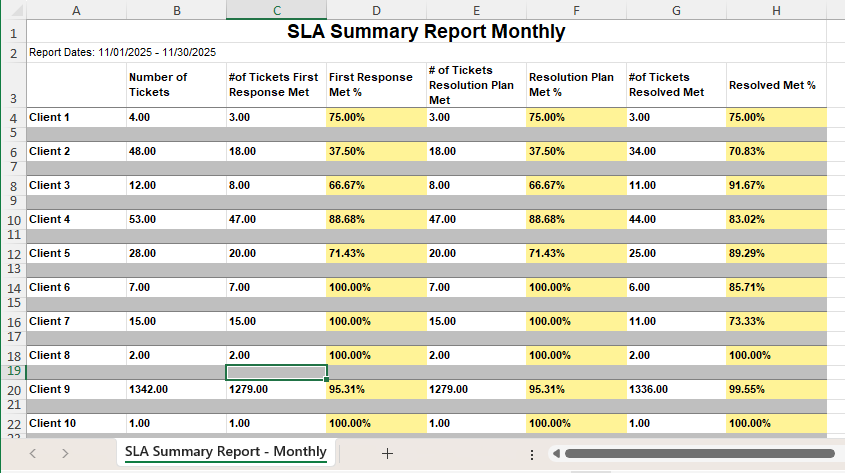
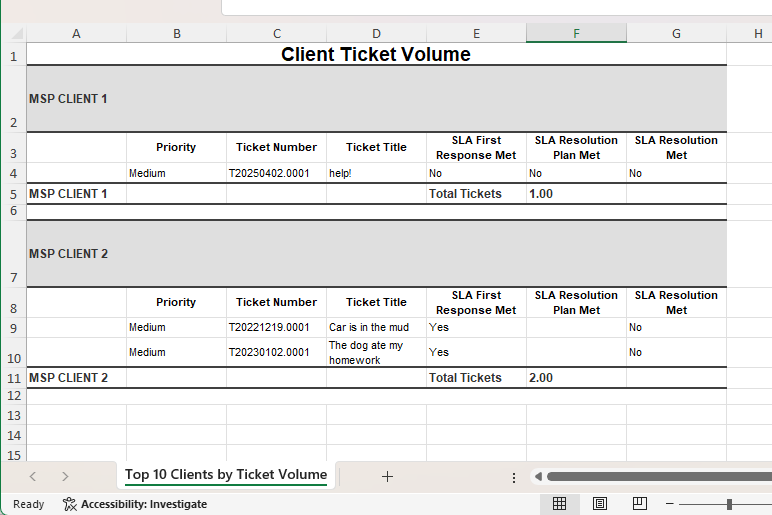
Includes 6 LiveReports focused on service volume, resolution time, and SLA consistency.
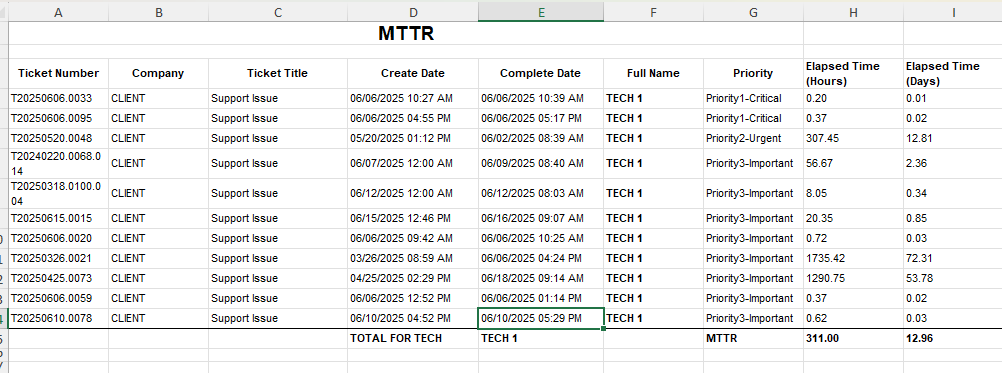
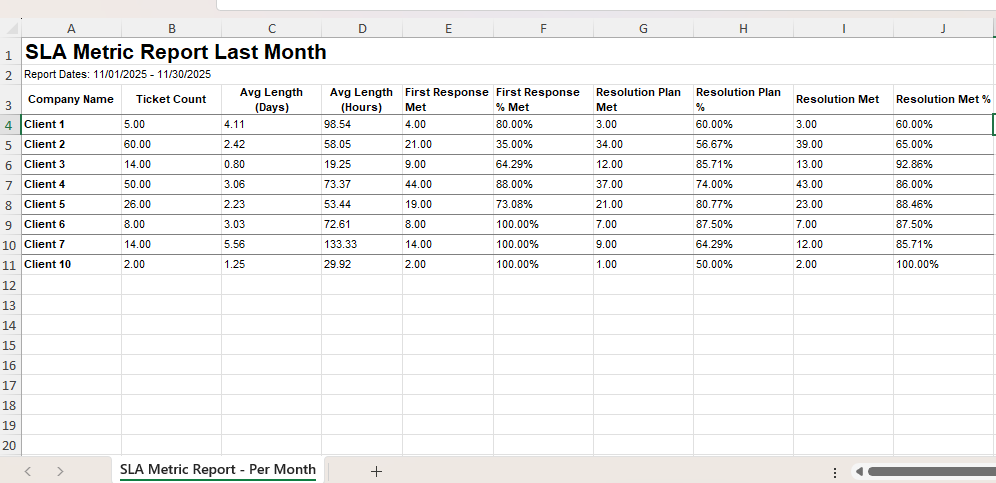
🔹 MTTR, SLA Summary, and SLA Metric reports
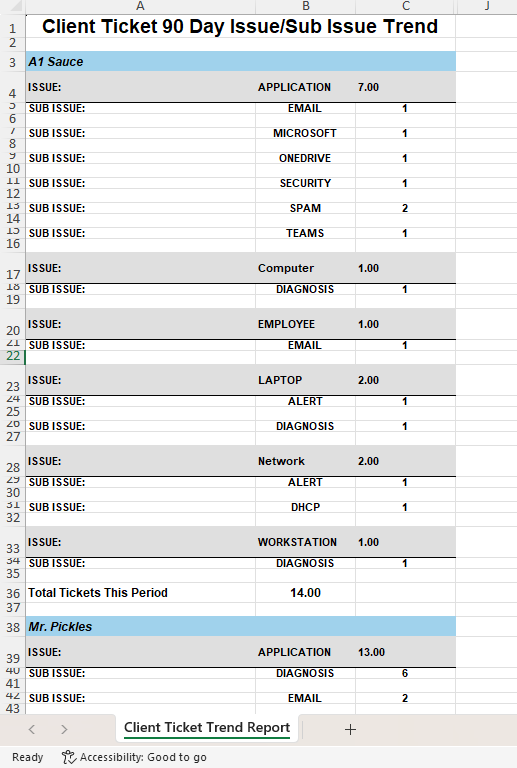
🔹 Issue/Sub-Issue breakdowns
🔹 Ticket Volume by Client
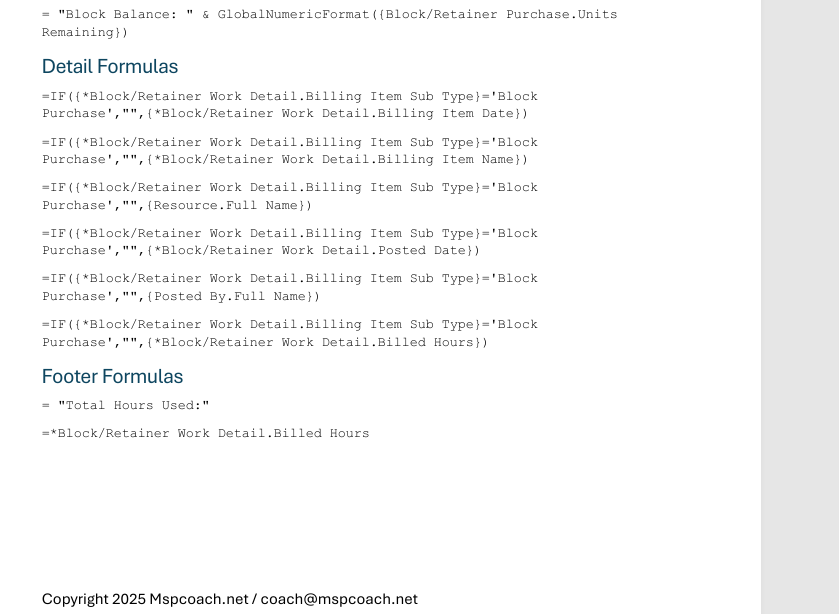
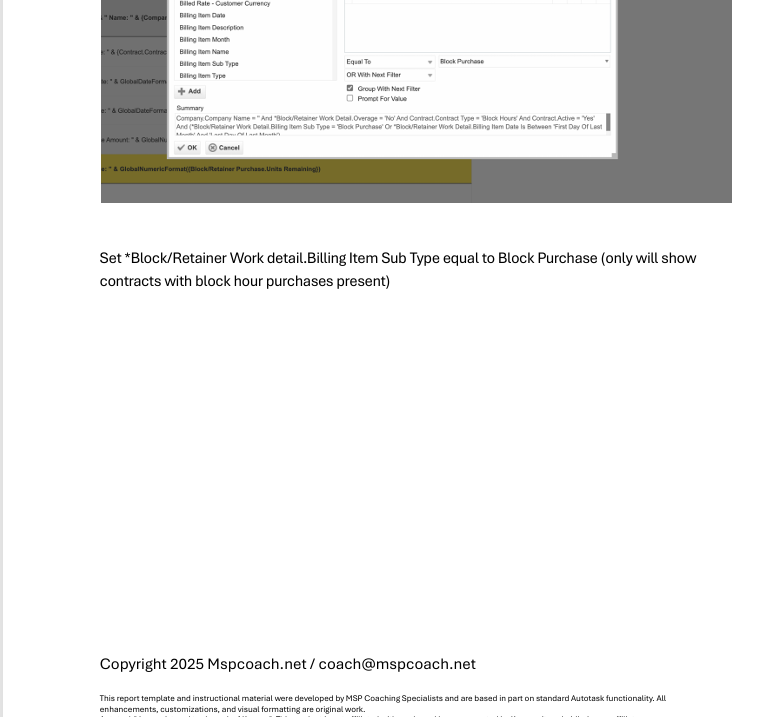
📄 Step-by-step build guides + copy-paste filters
🛠 Self-install or choose done-for-you support

Get a grip on margins, contract profitability, and client trends.
Designed to uncover financial blind spots in your Autotask data.
🔹 Charges and Profit per Client
🔹 Profit Summary by Contract
🔹 Contract Service Profitability
📄 Easy-to-follow guide PDFs + formulas included
🛠 Optional install support available