Image 1 of 4
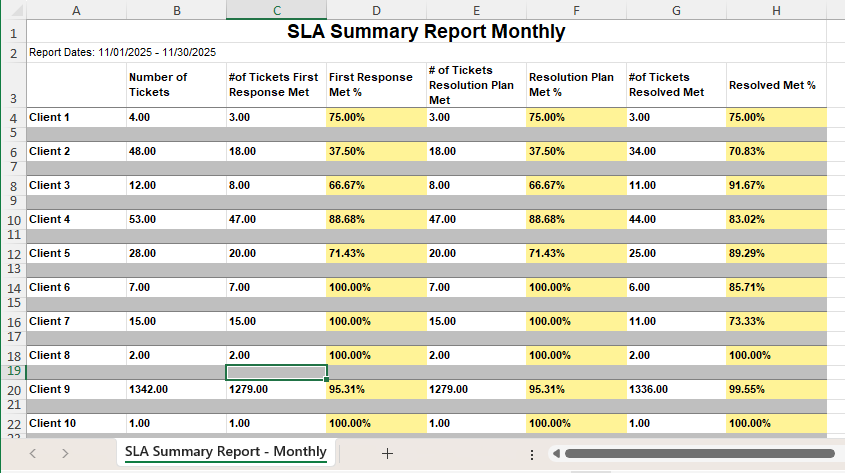 Image 2 of 4
 Image 3 of 4
 Image 4 of 4
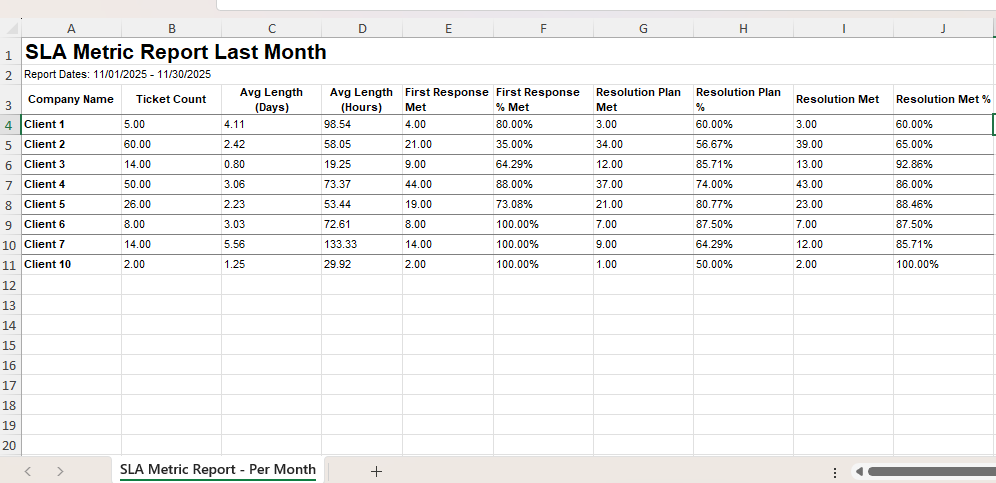
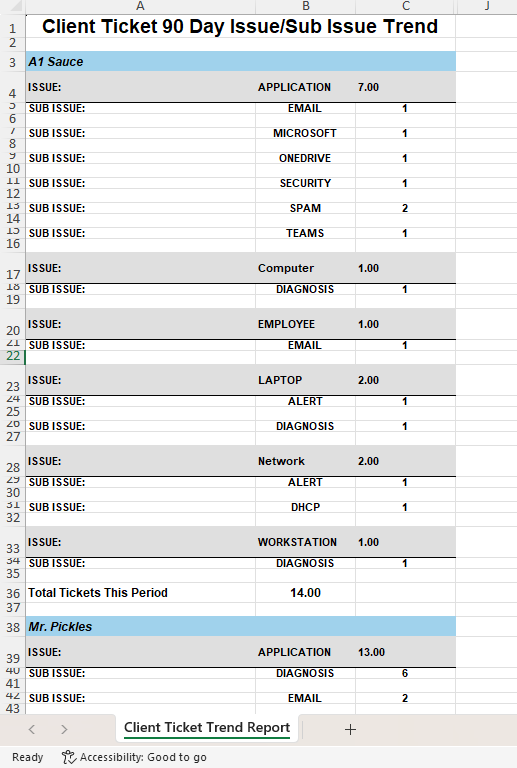
Stop guessing how your MSP is performing — this report tells you straight up.
The SLA Summary lists every client, their total ticket volume, how many tickets failed your SLA journey, and the percentage of success across your three SLA checkpoints. At a glance, you’ll see exactly where the service desk is performing well, where requests are falling through the cracks, and which clients are at risk of becoming “we’re canceling services” conversations.
This is the dashboard that exposes:
🔥 Clients quietly drowning in SLA failures
🧨 Techs who struggle with prioritization
🚫 Service issues blindsiding leadership
⚠️ Workflow and automation gaps destroying response times
🧩 Internal gaps in request handling that hurt client confidence
If you want a one-page SLA truth machine that instantly shows who’s protected and who’s slipping — this is it.
✔️ Quarterly Business Reviews / client-facing meetings
✔️ Service desk performance reviews
✔️ Proactive churn prevention
✔️ Identifying training + workflow gaps
✔️ Proving value with data, not vibes
📄 PDF Build Guide
Step-by-step walkthrough of the entire build
Every formula included + appendix for copy/paste
Field-by-field explanations so you actually learn LiveReports
🔧 Format & Structure Training
Why each step exists (not just “click here”)
Understand how LiveReports think so you can modify confidently
🎥 Support & Fine Tuning
Email support included
Short video explainers to help with tuning your layout
🚀 Optional Install Help
Skip the setup completely — I’ll install and tune it with you in your tenant
🔌 Plug-and-Play Ready
Built for most Autotask tenants
Use as-is or as a foundation for more advanced reporting
✨ Bonus
Learn a formatting approach you can reuse on every future report
Build your reporting confidence and reduce Autotask guesswork
Autotask LiveReports access
Service desk using SLAs
(Optional) Filters for time ranges or assigned technicians