Image 1 of 4
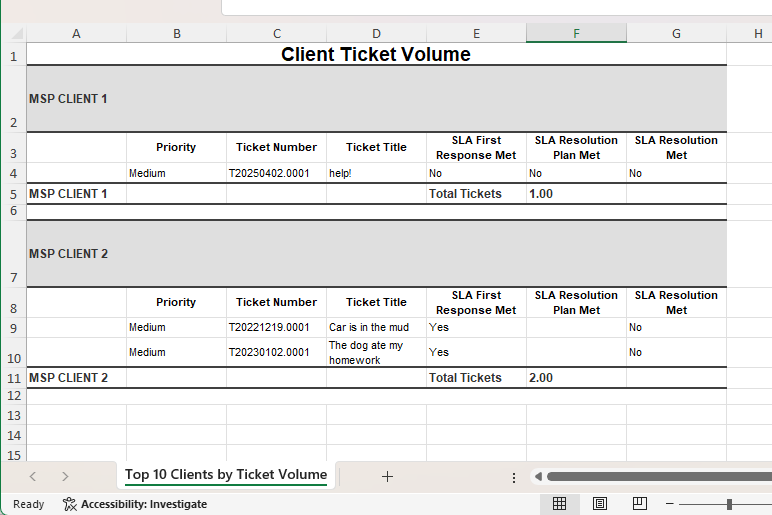 Image 2 of 4
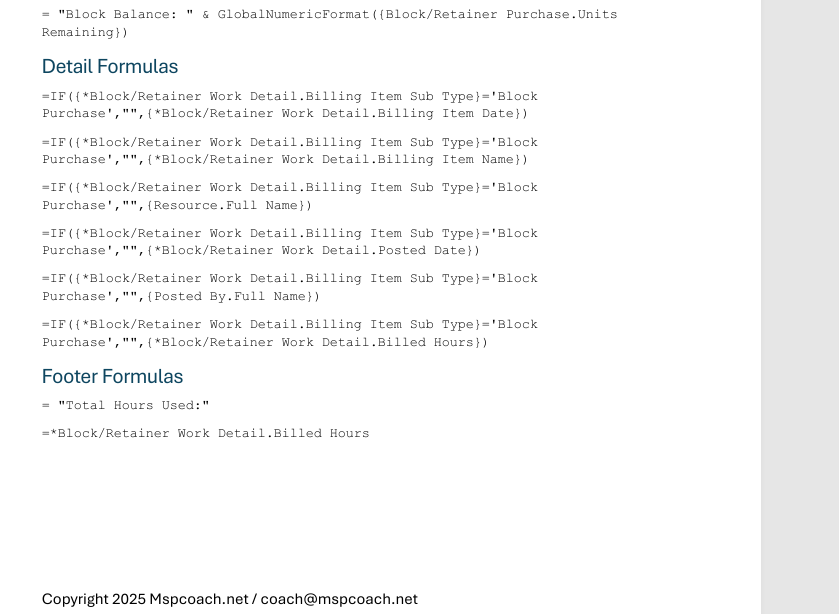 Image 3 of 4
 Image 4 of 4
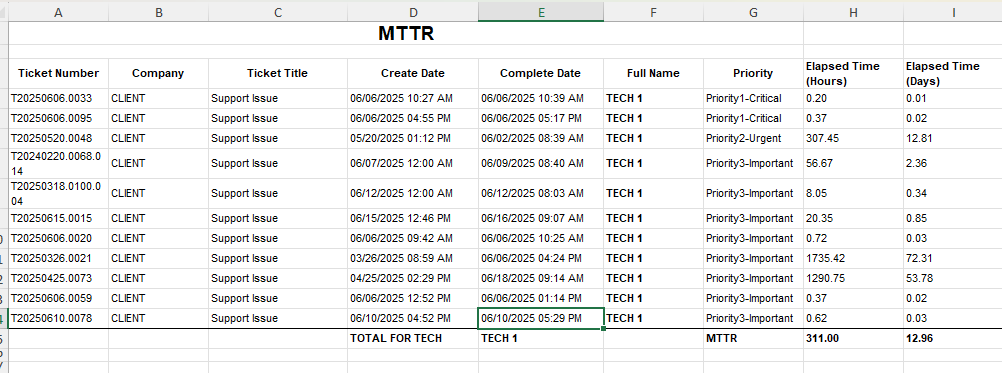
Shows total ticket by client to ideThis report shows ticket volume by client, with a breakdown of the actual tickets behind the numbers — not just a count. It’s perfect for understanding where your service load is coming from, which clients are consuming the most time, and how SLA performance aligns with ticket volume.
It’s not a vanity metric.
It’s client impact visibility.
If one client is generating 60% of your service load, this report is how you discover it — and how you start a conversation around onboarding cleanups, user training, contract scope, or service alignment.
✔️ Identifying “heavy use” clients draining the service desk
✔️ QBRs and monthly check-ins
✔️ Resetting expectations with over-consuming clients
✔️ Scoping managed services and renewals
✔️ Backing up contract pricing decisions with data
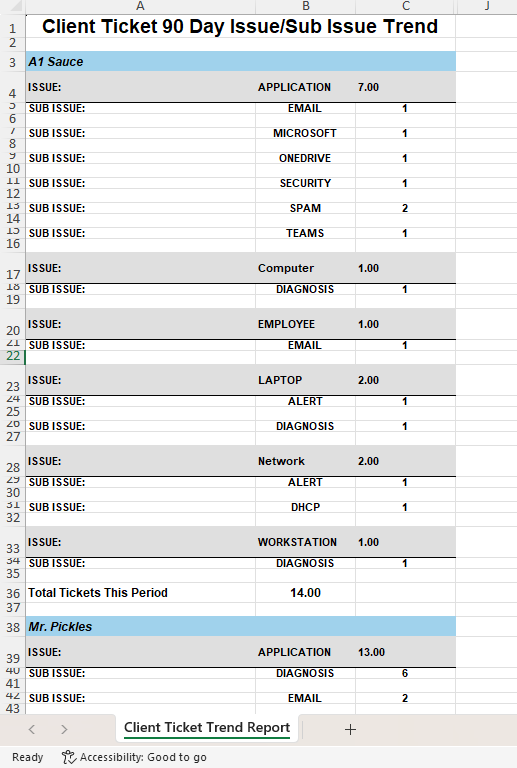
Ticket volume per client
Which priorities dominate their workload
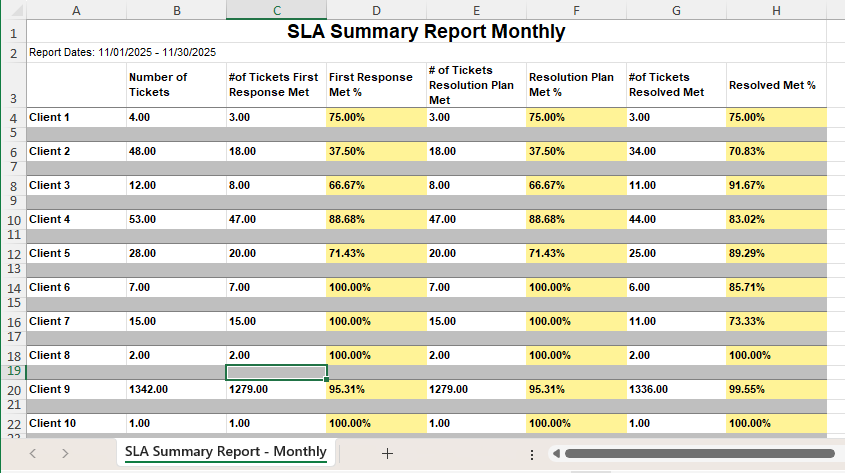
Quick view of SLA compliance per ticket
Evidence to justify escalations, price changes, or coaching
Clarity on where your team is actually spending time
This report turns:
“They take a lot of time”
into
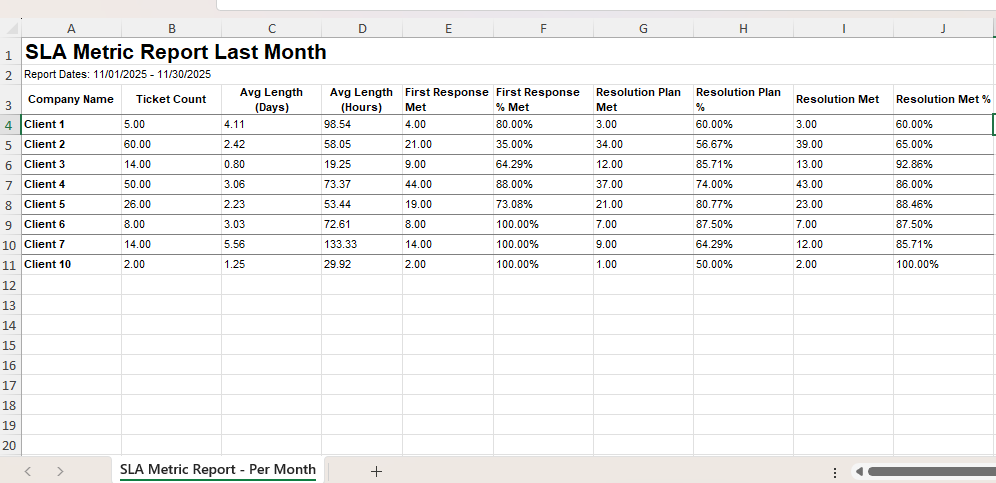
“They opened 42 tickets last month and missed SLA on 14% — let’s talk next steps.”
Now you’ve got leverage and clarity.
📄 PDF Build Guide
Step-by-step instructions
All formulas included (copy/paste appendix)
Field explanations so nothing breaks when you apply it
🔧 Format & Structure Training
Understand grouping, totals, and SLA display logic
Learn how to expand this into monthly trend reporting
🎥 Support & Fine Tuning
Email support included
Short video walk-throughs as needed
🚀 Optional Install Help (Add-On)
Available when bundling reports
🔌 Plug-and-Play Ready
Works in most Autotask tenants
✨ Bonus
Perfect stepping stone to deeper service consumption reporting
Autotask LiveReports access
SLA configuration helpful but not requiredntify high need accounts
Shows total ticket by client to ideThis report shows ticket volume by client, with a breakdown of the actual tickets behind the numbers — not just a count. It’s perfect for understanding where your service load is coming from, which clients are consuming the most time, and how SLA performance aligns with ticket volume.
It’s not a vanity metric.
It’s client impact visibility.
If one client is generating 60% of your service load, this report is how you discover it — and how you start a conversation around onboarding cleanups, user training, contract scope, or service alignment.
✔️ Identifying “heavy use” clients draining the service desk
✔️ QBRs and monthly check-ins
✔️ Resetting expectations with over-consuming clients
✔️ Scoping managed services and renewals
✔️ Backing up contract pricing decisions with data
Ticket volume per client
Which priorities dominate their workload
Quick view of SLA compliance per ticket
Evidence to justify escalations, price changes, or coaching
Clarity on where your team is actually spending time
This report turns:
“They take a lot of time”
into
“They opened 42 tickets last month and missed SLA on 14% — let’s talk next steps.”
Now you’ve got leverage and clarity.
📄 PDF Build Guide
Step-by-step instructions
All formulas included (copy/paste appendix)
Field explanations so nothing breaks when you apply it
🔧 Format & Structure Training
Understand grouping, totals, and SLA display logic
Learn how to expand this into monthly trend reporting
🎥 Support & Fine Tuning
Email support included
Short video walk-throughs as needed
🚀 Optional Install Help (Add-On)
Available when bundling reports
🔌 Plug-and-Play Ready
Works in most Autotask tenants
✨ Bonus
Perfect stepping stone to deeper service consumption reporting
Autotask LiveReports access
SLA configuration helpful but not requiredntify high need accounts