Image 1 of 1
Tech Daily Productivity + Dax Analyzer
$59.00
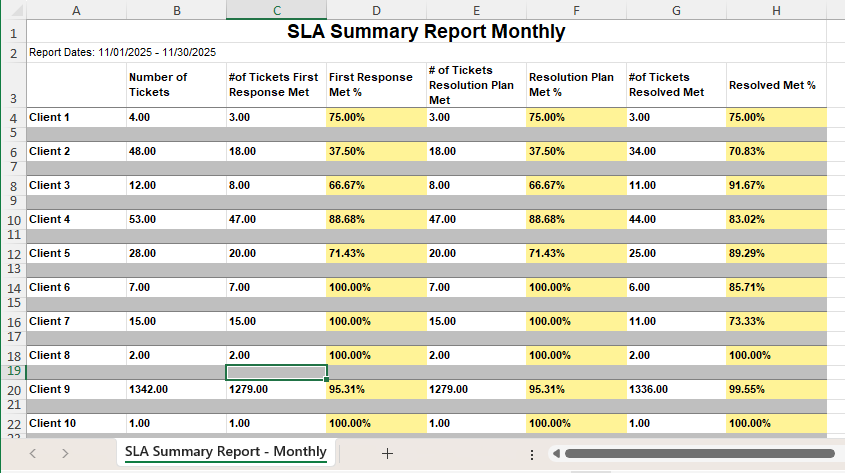
This report shows you how your technicians are actually spending their time — day by day — across tickets, work types, and billable vs non-billable effort.
It gives you a clear picture of productivity without turning into a micromanagement tool.
When paired with Dax Analyzer, the report becomes a coaching and capacity signal instead of just a scorecard.
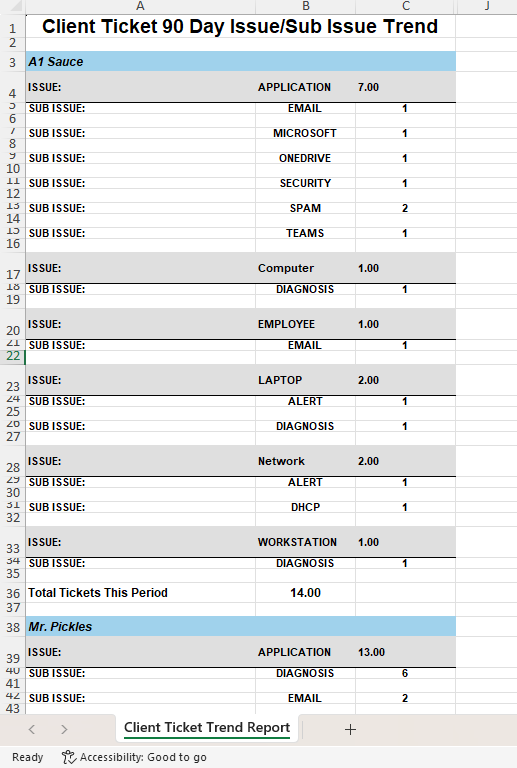
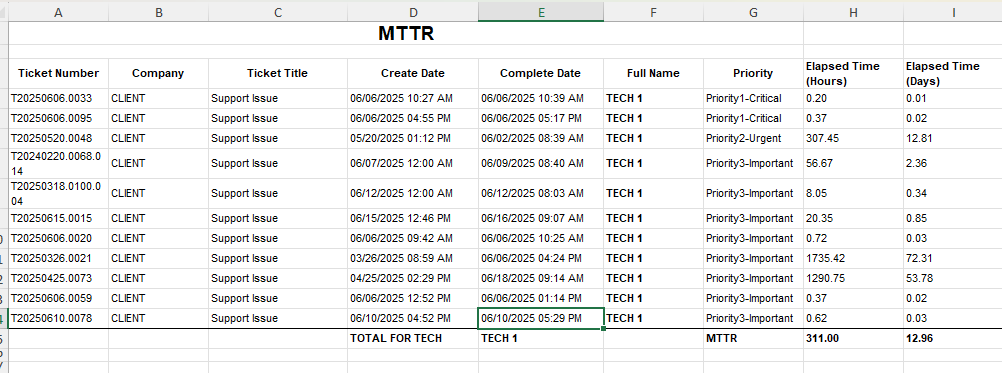
Daily hours logged per technician
Billable vs non-billable time
Time distribution across work types
Gaps, spikes, and inconsistencies in daily logging
On its own, this report highlights patterns.
With Dax, it explains what those patterns actually mean.
Dax reviews the report and identifies:
Technicians consistently under or over target hours
Days where time isn’t being logged accurately or completely
Patterns that suggest:
context switching overload
ticket sprawl
burnout risk
Variances between expected productivity and actual output
Trends that point to:
staffing or scheduling issues
training gaps
process friction
Dax doesn’t just call out numbers — he provides context so you know when to coach, when to adjust, and when to leave things alone.
Raw productivity numbers often cause the wrong reaction.
This report helps you:
Spot issues early without micromanaging
Separate process problems from people problems
Support technicians with data instead of assumptions
Make staffing decisions with confidence
The goal isn’t pressure.
It’s clarity.
Run the report daily or weekly
Review Dax’s analysis alongside the data
Focus on the signals that actually require action
No spreadsheets.
No guessing.
No reactive management.
This report shows you how your technicians are actually spending their time — day by day — across tickets, work types, and billable vs non-billable effort.
It gives you a clear picture of productivity without turning into a micromanagement tool.
When paired with Dax Analyzer, the report becomes a coaching and capacity signal instead of just a scorecard.
Daily hours logged per technician
Billable vs non-billable time
Time distribution across work types
Gaps, spikes, and inconsistencies in daily logging
On its own, this report highlights patterns.
With Dax, it explains what those patterns actually mean.
Dax reviews the report and identifies:
Technicians consistently under or over target hours
Days where time isn’t being logged accurately or completely
Patterns that suggest:
context switching overload
ticket sprawl
burnout risk
Variances between expected productivity and actual output
Trends that point to:
staffing or scheduling issues
training gaps
process friction
Dax doesn’t just call out numbers — he provides context so you know when to coach, when to adjust, and when to leave things alone.
Raw productivity numbers often cause the wrong reaction.
This report helps you:
Spot issues early without micromanaging
Separate process problems from people problems
Support technicians with data instead of assumptions
Make staffing decisions with confidence
The goal isn’t pressure.
It’s clarity.
Run the report daily or weekly
Review Dax’s analysis alongside the data
Focus on the signals that actually require action
No spreadsheets.
No guessing.
No reactive management.