Image 1 of 4
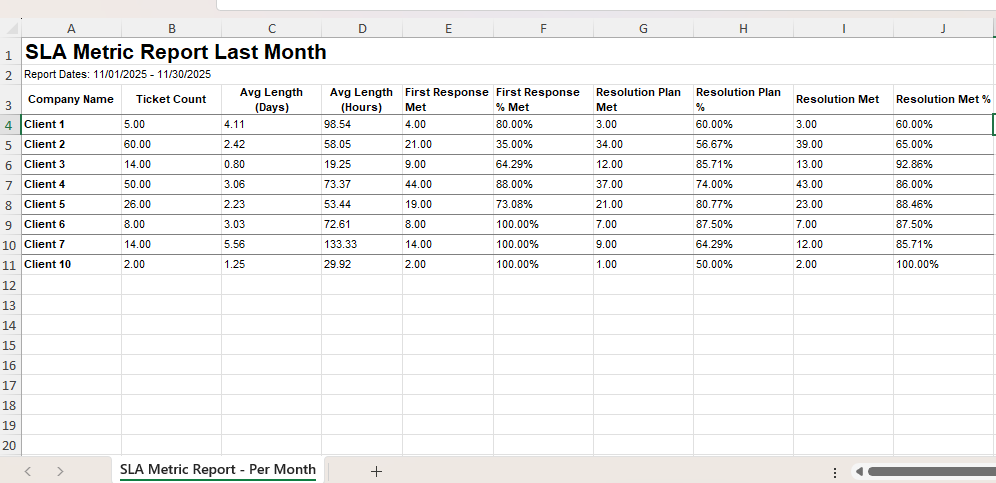 Image 2 of 4
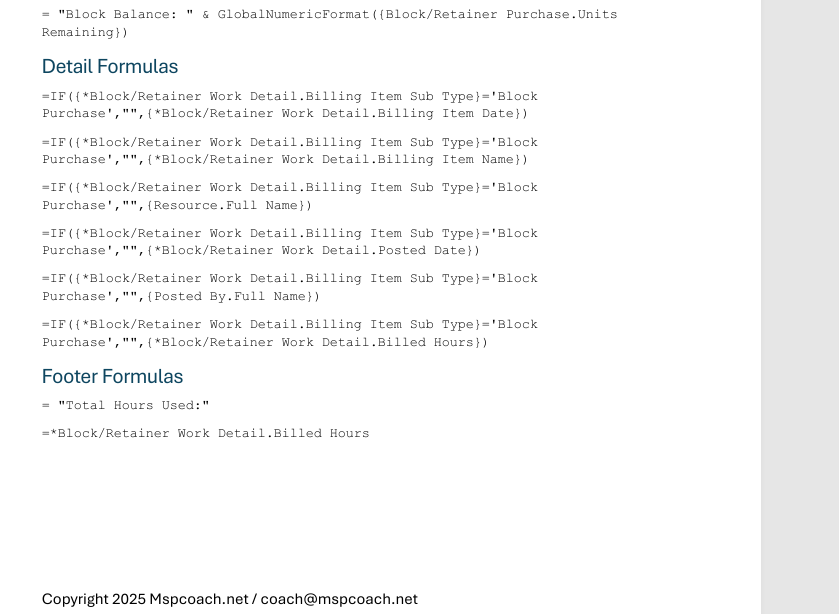 Image 3 of 4
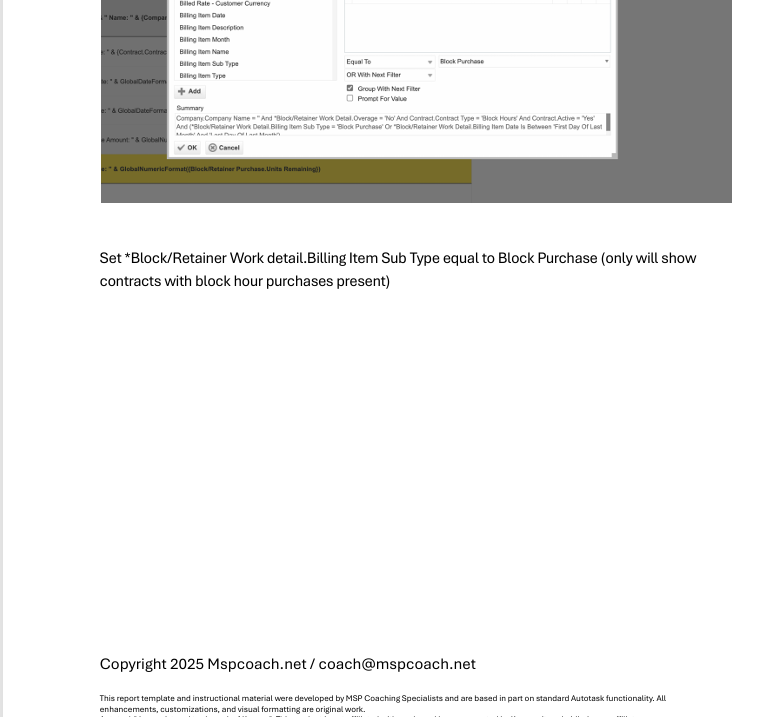 Image 4 of 4
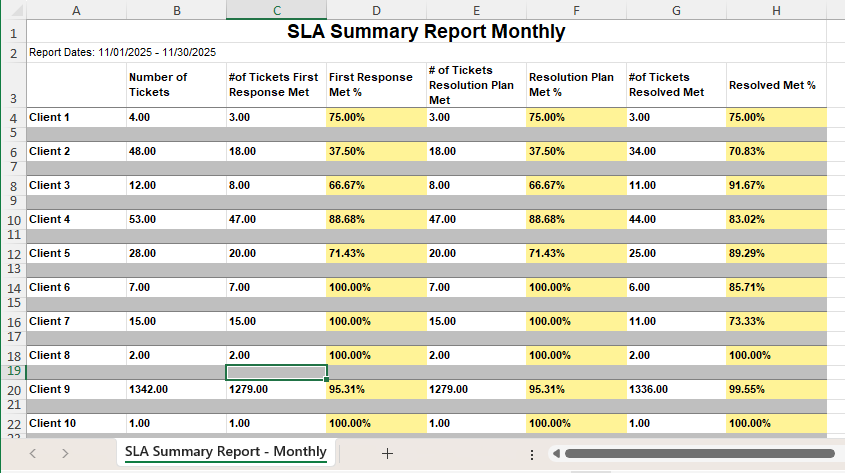
This report breaks down SLA performance by client, showing ticket volume against the three major SLA milestones and the percentages met for each. It’s the closest thing to a monthly service scorecard — tracking how well your team is honoring response, planning, and resolution commitments.
Instead of just saying, “We hit our SLAs,” you can prove it — or identify where you didn’t — with a clean breakdown that goes straight into QBRs, renewal conversations, and internal coaching.
This is how you translate service delivery into client confidence.
✔️ QBRs and renewal prep
✔️ Monthly service reporting
✔️ Identifying service delivery pain points
✔️ Client relationship management
✔️ Internal benchmarks + accountability
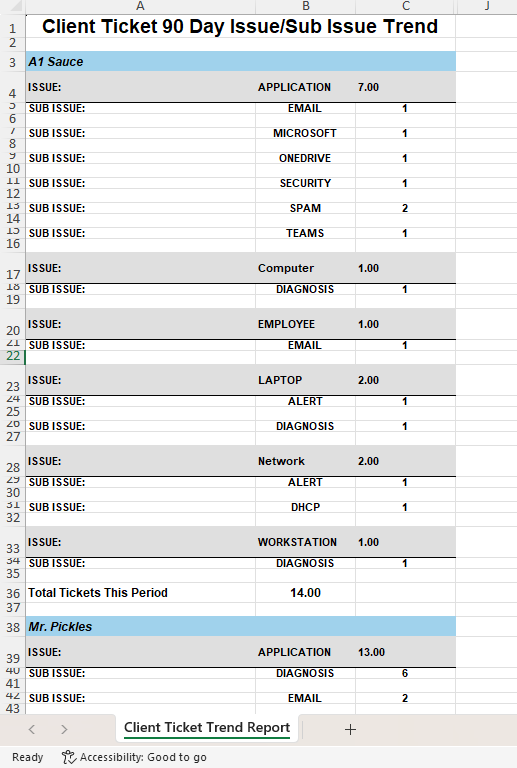
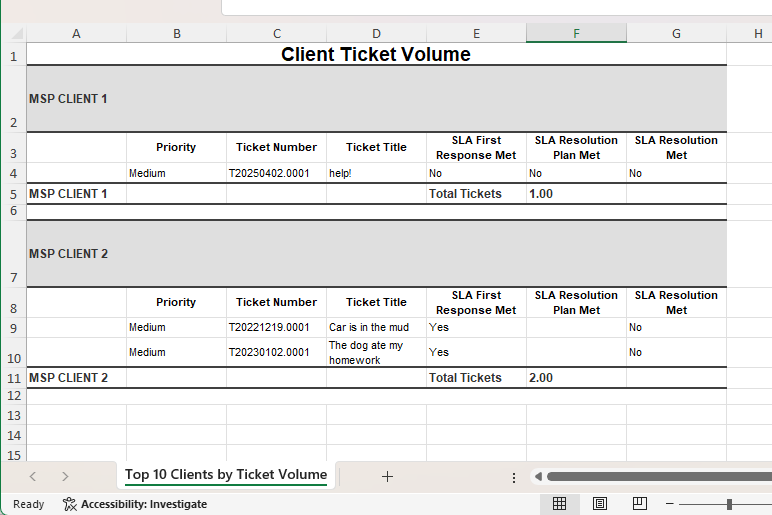
Ticket count per client
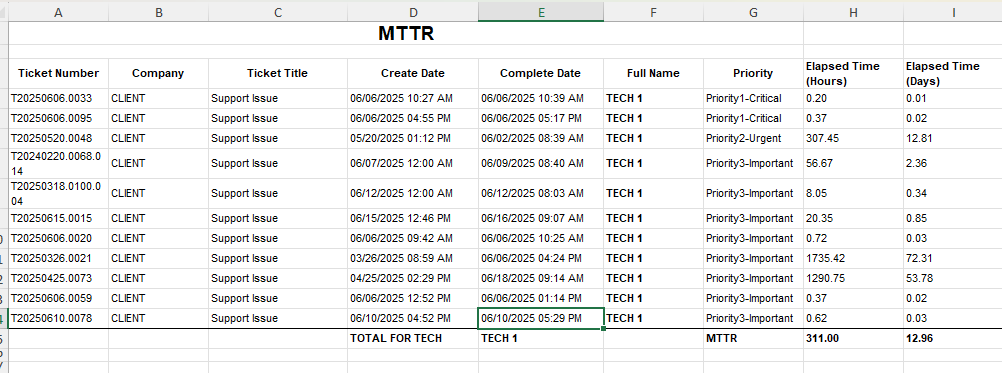
Time to respond / plan / resolve in hours + days
SLA percentage achieved for each milestone
Which milestones you miss most often
Where to prioritize operational improvements
This becomes a conversation tool — not just a report.
It helps you say things like:
“You had 60 tickets this month. We missed first response on 35%, so let’s fix that before it becomes a recurring pain.”
or
“We hit 92.8% resolution compliance — here’s what we’re improving next.”
Trust is built on visibility. This gives it to you.
📄 PDF Build Guide
Step-by-step build instructions
All formulas included with a copy/paste appendix
Field-level clarity so you understand the structure
🔧 Format & Structure Training
Learn how SLA fields behave in Autotask
Avoid the “why doesn’t this calculate correctly” math traps
🎥 Support & Fine Tuning
Email support included
Short tuning/tutorial videos available
🚀 Optional Install Help (Add-On)
Available when bundling multiple reports
🔌 Plug-and-Play Ready
Built around standard Autotask SLA configs
✨ Bonus
Perfect plug-in for your QBR template
Turns SLA into a dashboard conversation, not a mystery metric
Autotask LiveReports access
SLA events configured in Autotask
This report breaks down SLA performance by client, showing ticket volume against the three major SLA milestones and the percentages met for each. It’s the closest thing to a monthly service scorecard — tracking how well your team is honoring response, planning, and resolution commitments.
Instead of just saying, “We hit our SLAs,” you can prove it — or identify where you didn’t — with a clean breakdown that goes straight into QBRs, renewal conversations, and internal coaching.
This is how you translate service delivery into client confidence.
✔️ QBRs and renewal prep
✔️ Monthly service reporting
✔️ Identifying service delivery pain points
✔️ Client relationship management
✔️ Internal benchmarks + accountability
Ticket count per client
Time to respond / plan / resolve in hours + days
SLA percentage achieved for each milestone
Which milestones you miss most often
Where to prioritize operational improvements
This becomes a conversation tool — not just a report.
It helps you say things like:
“You had 60 tickets this month. We missed first response on 35%, so let’s fix that before it becomes a recurring pain.”
or
“We hit 92.8% resolution compliance — here’s what we’re improving next.”
Trust is built on visibility. This gives it to you.
📄 PDF Build Guide
Step-by-step build instructions
All formulas included with a copy/paste appendix
Field-level clarity so you understand the structure
🔧 Format & Structure Training
Learn how SLA fields behave in Autotask
Avoid the “why doesn’t this calculate correctly” math traps
🎥 Support & Fine Tuning
Email support included
Short tuning/tutorial videos available
🚀 Optional Install Help (Add-On)
Available when bundling multiple reports
🔌 Plug-and-Play Ready
Built around standard Autotask SLA configs
✨ Bonus
Perfect plug-in for your QBR template
Turns SLA into a dashboard conversation, not a mystery metric
Autotask LiveReports access
SLA events configured in Autotask